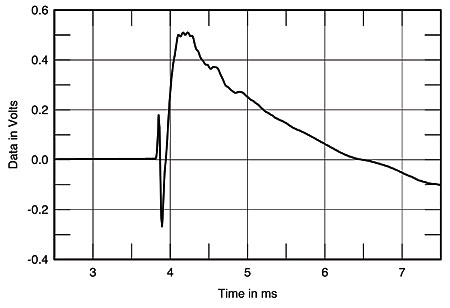
For the super audio geeks out there, here's the impulse response of these Statement 1 loudspeakers:

This was measured from the listening position, so there is more early reflection energy in the voltage curve than you'd see in a lab environment. That said, the overall impulse ends at 0.5mS and everything is damn near perfectly aligned, to within less than 0.1mS accuracy. The audible result is higher clarity and realism in reproduced music. Basically this is nearly as good a single driver system, but with the higher dynamics, lower distortion, and great bass impact of a large multi-way speaker system.
This was measured from the listening position, so there is more early reflection energy in the voltage curve than you'd see in a lab environment. That said, the overall impulse ends at 0.5mS and everything is damn near perfectly aligned, to within less than 0.1mS accuracy. The audible result is higher clarity and realism in reproduced music. Basically this is nearly as good a single driver system, but with the higher dynamics, lower distortion, and great bass impact of a large multi-way speaker system.
") ) Does it actually "decipher" the harmonics from the fundamental tone being played at any given time?
) Does it actually "decipher" the harmonics from the fundamental tone being played at any given time?