• Welcome to The Audio Annex! If you have any trouble logging in or signing up, please contact 'admin - at - theaudioannex.com'. Enjoy!
  • HTTPS (secure web browser connection) has been enabled - just add "https://" to the start of the URL in your address bar, e.g. "https://theaudioannex.com/forum/"
  • Congratulations! If you're seeing this notice, it means you're connected to the new server. Go ahead and post as usual, enjoy!
  • I've just upgraded the forum software to Xenforo 2.0. Please let me know if you have any problems with it. I'm still working on installing styles... coming soon.

HSU VTF-15H In room measurements - All 15 configurations.

nelmr

Active Member
Okay guys, I went ahead and tried all Q settings, all port configurations, and all valid EQ settings. This comes to a total of 15 different options. Note EQ1 is not to be used with both ports open, otherwise it would have been 18 configurations (3*3*2). I'm using the RS Meter w/ calibration file and an uncalibrated sound card (so yeah not really accurate, I know, but it's all I have). These graphs though can help compare relative differences though.

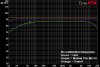
Below is the first graph (FR response) I'll post in this thread (more to come soon). It is all of the configurations together. It's a bit hard to read, but it should show you the extent one can tune this subwoofer.

I crossed the right front speaker over at 120hz and played a 10-80hz 24 second sweep. This should mostly show output just from the sub. The mic remained in the same location for all measurements on a tripod in the listening position One measurement per configuration (no averaging).:

15configs.png


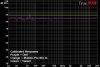
Here is the phase responses (interesting that they aren't the same):
15phases.png
 
Re: HSU VTF-15H In room measurements - All 15 configurations

As an attempt to make it easier to read, here is the FR response with each measurement separated:

15seperated.png
 
Re: HSU VTF-15H In room measurements - All 15 configurations

And here is the group delay. Which is similar above 30hz, slightly different below (ignore the timings in the legend as they are for specific frequencies, the latter I believe is for 15.75hz):

15gd.png

15gdseperated.png
 
Re: HSU VTF-15H In room measurements - All 15 configurations

Also in case you are wondering what the effect of the EQ, Q, and port settings are, I averaged each of the individual settings from the 15 configurations. Here are the overall effects:

averagedeqfr.png

averagedportsfr.png

averagedqfr.png
 
Re: HSU VTF-15H In room measurements - All 15 configurations

Them's some purdy lines there. What's up with the huge dip around 58Hz....
 
Re: HSU VTF-15H In room measurements - All 15 configurations

Alien said:
Them's some purdy lines there. What's up with the huge dip around 58Hz....

I'm guessing a pretty bad null. It might be a very small one right at the mic position. I'll try taking 3 measurements on my couch in each of the three seats and then also average them to see if it goes a way.
 
Re: HSU VTF-15H In room measurements - All 15 configurations

I measured 5 locations, all pretty much the same distance from the front wall though. These are chair left of couch, left couch, center couch (original measurement), right couch, chair right of couch. I would presume that the problem is a standing wave running along the front and back walls of the room. I'm using the EQ1, Q0.3, and 1 port open for these measurements:

average5listeningspots.png

differentlisteninglocat.png
 
Re: HSU VTF-15H In room measurements - All 15 configurations

I don't know what most of those charts are about, but I have played with frequency response charts. When I measure for low freqs, just moving the mic around the area where my head would be in the prime listening position will result in frequency response changes, so I think taking multiple measurements would be a good idea.

Also, it looks like all the various settings of the sub do not change the freq response very much at all. In fact, above 20Hz they look almost identical.

Just some thoughts on the freq response charts. I have no idea what to make of the others.
 
Re: HSU VTF-15H In room measurements - All 15 configurations

I would have like to take maybe 3-4 measurements maybe 4-6 inches apart around the listening location and average them. However doing that for each of the combination's would have resulted in 45-60 measurements. That would have taken me at least 1-2 hours to do. Maybe I do some averaged measurements for the setting I think I'm leaning towards (EQ1, 1 port open, Q0.3).

However the graphs do help show the differences of the settings. I disagree that there isn't much variation above 20hz. The first graph shows this best. Here is the variance of response at each freq:

17Hz: 15dB
20Hz: 12dB
30Hz: 8.5dB
40Hz: 7dB
50Hz: 5dB
65Hz: 3dB

It's only near the 58Hz null and above 75Hz that the differences are less than 3dB. Of course this is comparing mostly ported (yellow, purple, blue) vs. sealed output (grey and green plots). The differences variance between ported configurations is less (and harder to tell with the graphs) but is something like:

17Hz: 10dB
20Hz: 8dB
30Hz: 5dB
40Hz: 3dB
50Hz: 3dB
65Hz: 2dB

Of course my room acoustics play a part on these graphs. The settings may make a bigger or smaller difference in a different room.
 
Re: HSU VTF-15H In room measurements - All 15 configurations

nelmr said:
I would have like to take maybe 3-4 measurements maybe 4-6 inches apart around the listening location and average them. However doing that for each of the combination's would have resulted in 45-60 measurements. That would have taken me at least 1-2 hours to do. Maybe I do some averaged measurements for the setting I think I'm leaning towards (EQ1, 1 port open, Q0.3).

However the graphs do help show the differences of the settings. I disagree that there isn't much variation above 20hz. The first graph shows this best. Here is the variance of response at each freq:

17Hz: 15dB
20Hz: 12dB
30Hz: 8.5dB
40Hz: 7dB
50Hz: 5dB
65Hz: 3dB

It's only near the 58Hz null and above 75Hz that the differences are less than 3dB. Of course this is comparing mostly ported (yellow, purple, blue) vs. sealed output (grey and green plots). The differences variance between ported configurations is less (and harder to tell with the graphs) but is something like:

17Hz: 10dB
20Hz: 8dB
30Hz: 5dB
40Hz: 3dB
50Hz: 3dB
65Hz: 2dB

I'm not sure what you are referring to with the above lists.

But let me be clear about what I am saying. I can see from the first FR graph that the changes you made in settings cause a difference in SPL. But when I look at the second FR graph, where it is easier to see the curve of each graph, the SHAPE OF THE CURVE looks the same. I take this to mean the the changes on the sub settings affected the SPL level, but not the flatness of the response. It seems to me that SPL could be changed just by turning the sub up. So, I don't see what the changing all the settings has done for you, other than being a complicated way of turning up the volume.

Now, I must say that, in FR chart #1, I see a bit more variance in the SHAPE curves between 20 and 30Hz than I do in graph #2, but above 30Hz, the SHAPE of all the curves looks almost identical. Perhaps, I am not allowing very small differences to be considered differences. On the other hand, if my memory serves me correctly, I do not think human beings can hear well enough in that region, to be able to distinguish very small differences.
 
Re: HSU VTF-15H In room measurements - All 15 configurations

Aaron German said:
I'm not sure what you are referring to with the above lists.

But let me be clear about what I am saying. I can see from the first FR graph that the changes you made in settings cause a difference in SPL. But when I look at the second FR graph, where it is easier to see the curve of each graph, the SHAPE OF THE CURVE looks the same. I take this to mean the the changes on the sub settings affected the SPL level, but not the flatness of the response. It seems to me that SPL could be changed just by turning the sub up. So, I don't see what the changing all the settings has done for you, other than being a complicated way of turning up the volume.

Now, I must say that, in FR chart #1, I see a bit more variance in the SHAPE curves between 20 and 30Hz than I do in graph #2, but above 30Hz, the SHAPE of all the curves looks almost identical. Perhaps, I am not allowing very small differences to be considered differences. On the other hand, if my memory serves me correctly, I do not think human beings can hear well enough in that region, to be able to distinguish very small differences.

Aaron, I can see where you are coming from. A few things though to consider. The reason why the differences appear to be less on the separated FR graph is that each horizontal line is a 20dB difference whereas the first graph is only 5dB. That's why I also did an average graph for the Port, EQ, and Q settings. These help show the variance a bit easier.

Regarding the 2nd FR graph, the curve difference between each main setting (port and EQ combination [i.e. color]) seems to have the most variance. This is because EQ1 seems to boost below 25HZ quite a bit and both ports open seem to roll off quickly below 22Hz. Sealed vs. 1 port open only seem to be a SPL difference as the blue and green plots have similar "shape". Just as grey and purple have similar shape.

It's only the Yellow plot that is most different compared to the others. It supposedly has the most output, but looses out on output below 22Hz.

Now, the difference between the Q setting doesn't seem much different (variance within each color). I agree that setting doesn't do as much as the others. It appears to just slightly boost SPL below 40hz.

One other thing to consider is that these setting no doubt affect the efficiency of the sub at each freq. So it's not quite the same as just turning up (or down) the volume. The sealed EQ1 settings have similar shape to the ported EQ1 setting. However, I'm sure the ported configuration will have more max output.

Flint, mentions that the Q control may affect how loose or tight the bass is, as well as how much output it can have. So those are other considerations.
 
Re: HSU VTF-15H In room measurements - All 15 configurations

Which measurement microphone are you using?
 
Re: HSU VTF-15H In room measurements - All 15 configurations

Flint said:
Which measurement microphone are you using?

It was in my first paragraph in post 1 ;)

I did find this article about the RS Meter(s):
http://www.audioxpress.com/magsdirx/ax/addenda/media/koya2811.pdf

I am using the NEW version since my OLD version seems to not always want to respond (the meter bounces funny or not at all, especially at the 60dB setting). But when it does work it is similar overall SPL to the new RS meter though about 1dB less. After looking at the above link, maybe I should have used the old meter for bass measurements, even though it's not always working (I've dropped it a few times).

I realize that what appears flat in the charts may not really be flat. But the variance between settings (which I was interested in) should still be evident.
 
Re: HSU VTF-15H In room measurements - All 15 configurations

The charts are revealing in terms of what may have changed with the various settings. However, they do not represent what is actually being measured in any real terms since the RS Meter in all iterations is notoriously inaccurate below about 30Hz. Most of the variation you are measuring is below 30Hz, and from my own experience with three different models of the RS Meter, nothing in that sub-bass region can be remotely accurately measured with those sources. No amount of calibration (EQ) curves can compensate for the limitations of the system when you have to boost the output by over 10dB.

If you want to pursue this hobby for the long haul, I strongly recommend an affordable measurement mic and a sound card you can calibrate. Below are measurements I made five years ago of three potential options for sound cards. To be fair, Dell has vastly improved the quality of the built in notebook sound cards since I made those measurements, but the issues are still apparent even with modern units.
 

Attachments

  • SoundCards_No_Cal_Resp.jpg
    SoundCards_No_Cal_Resp.jpg
    75 KB · Views: 2,538
  • SoundCards_Cal_Resp.jpg
    SoundCards_Cal_Resp.jpg
    74.3 KB · Views: 2,538
  • SoundCards_Noise.jpg
    SoundCards_Noise.jpg
    80.2 KB · Views: 2,538
Re: HSU VTF-15H In room measurements - All 15 configurations

Flint said:
The charts are revealing in terms of what may have changed with the various settings. However, they do not represent what is actually being measured in any real terms since the RS Meter in all iterations is notoriously inaccurate below about 30Hz. Most of the variation you are measuring is below 30Hz, and from my own experience with three different models of the RS Meter, nothing in that sub-bass region can be remotely accurately measured with those sources. No amount of calibration (EQ) curves can compensate for the limitations of the system when you have to boost the output by over 10dB.

If you want to pursue this hobby for the long haul, I strongly recommend an affordable measurement mic and a sound card you can calibrate. Below are measurements I made five years ago of three potential options for sound cards. To be fair, Dell has vastly improved the quality of the built in notebook sound cards since I made those measurements, but the issues are still apparent even with modern units.

I'll agree that the response isn't accurate (i.e I don't know which plot really is the flattest).

The cost though of the ECM8000 ($55) and M-Audio sound cards (MoblePre $99, MoblePre MKII 4 $150) aren't cheap. That's $155 - 200 depending on the sound card. Right now, I'd rather put that money towards speakers as I'm saving up to replace my mains.

My noise on the notebook sound card is similar. It's a 3 year old Dell by the way.
 
Re: HSU VTF-15H In room measurements - All 15 configurations

If I did get a better measurement setup what all would I need other than the USB preamp and mic? I'm not sure how to mount the condenser mic on my tripod either...

Also, what about these pre amps (all cheaper than the M-Audio offerings):

$40 http://www.bhphotovideo.com/c/product/522285-REG/MXL_MIC_MATE_USB_Mic_Mate_.html

$70 http://www.bhphotovideo.com/c/produ...P_PROJECT_S_W_USB_Tube_MP_Project_Series.html

$80 http://www.sears.com/shc/s/p_10153_...9x00001a&ci_src=14110944&ci_sku=SPM1547001401
 
Re: HSU VTF-15H In room measurements - All 15 configurations

DIYer said:
nelmr said:
Those two combined saves only $35. Why not just go for Behringer mic and Mobile-pre.

The $40 item is a preamp.

Also what about the Dayton Audio EM6 mic? Is is any better (or worse than the Behringer?).

Also, either of those mics can have a bit of variance to them from model to model. You can buy calibrated versions of these mics from starting from $80 and $70 respectively.

Would said calibration be necessary for accuracy (as the cross-spectrum site seems to suggest)?
 
Re: HSU VTF-15H In room measurements - All 15 configurations

My Behringer mic is a stock and I used my TrueRTA calibration process. It's been fine so far.
 
Back
Top